Hunger Data
Hunger is rising in Minnesota. Last year, Minnesotans made over 9 million visits to food shelves.
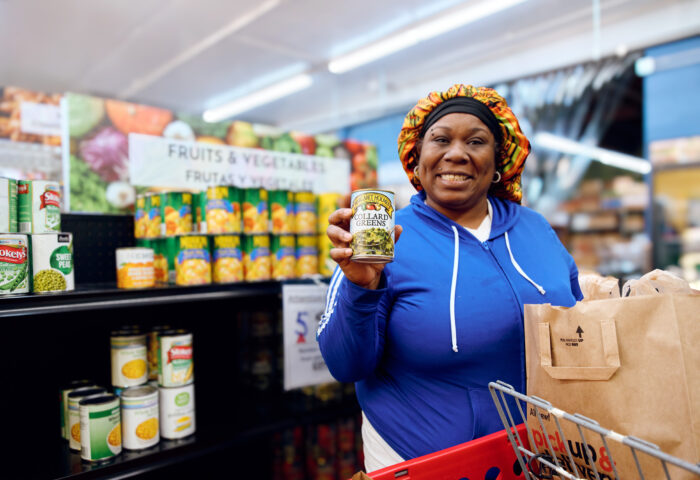

Mapping Hunger in Minnesota
The Food Group works with our partners to collect timely statistics on how many individuals are using food shelves in Minnesota. We analyze the trends, compile regular reports, and map hunger needs throughout Minnesota.
2025 By The Numbers
Highlights from 2025
Here are some highlights from our 2025 Food Shelf Visit Report.






Data Collection & Tranparency
The Food Group is committed to transparent data collection process and oversight. Our food shelf data comes from Minnesota’s food shelves and is calculated based on the number of visitors reported by each food shelf. The food shelves represented are TEFAP-eligible and are monitored by the Department of Children, Youth, and Family’s Office of Economic Opportunity and local food banks.
Compare with Previous Years
View our report archive to see how the latest numbers stack up with past years.